


10 Financial Blind Spots in Multi-Specialty Groups When Benchmark Drift Goes Unnoticed
Why Benchmark Drift Has Become a Silent Financial Risk?
Multi-specialty groups depend on benchmarks to guide staffing, productivity, compensation, and contract performance. RVUs, cost per encounter, denial rates, charge capture, and provider productivity benchmarks shape daily operational decisions.But benchmarks don’t fail loudly. They drift quietly.
When benchmarks are not recalibrated to reflect changes in payer mix, service line complexity, provider behavior, or regulatory pressure, they slowly lose relevance. Leadership teams continue managing performance against numbers that no longer reflect reality.
The result is a dangerous blind spot: decisions that look data-driven but are financially misaligned.
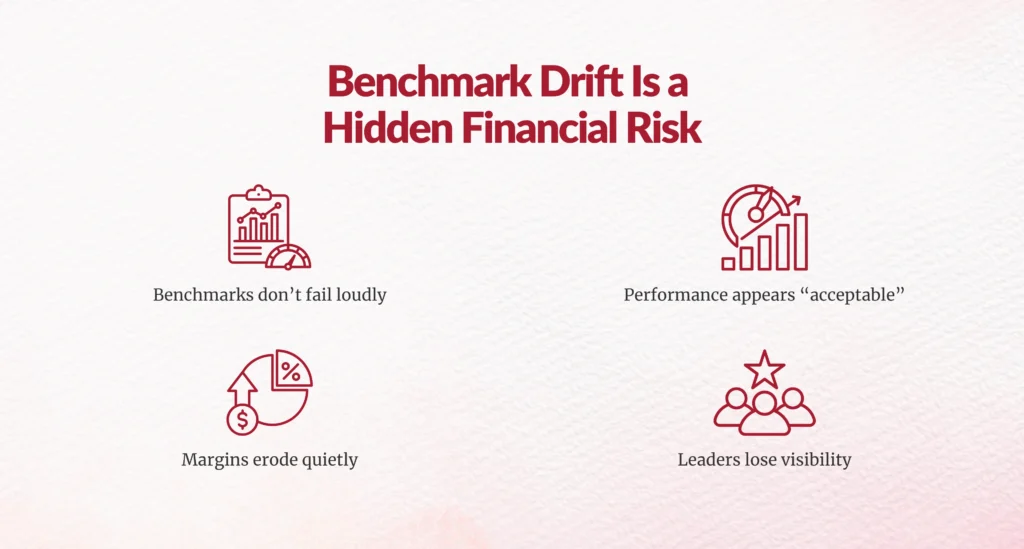
Benchmark drift doesn’t trigger alarms. It doesn’t cause immediate losses. Instead, it compounds small inefficiencies across departments until margins erode, productivity stalls, and leaders can’t explain why performance “feels off” despite meeting targets.
Below are 10 critical financial blind spots multi-specialty groups face when benchmark drift goes unnoticed and why addressing them early is essential for sustainable performance.

What Is Benchmark Drift and Why Does It Matter Financially?
Benchmark drift occurs when performance benchmarks remain static while the organization’s operating reality changes.
This can include:
- Shifts in payer mix toward value-based contracts
- Increased clinical complexity without updated productivity expectations
- New documentation, coding, or compliance requirements
- Technology adoption altering workflows
- Provider burnout impacting throughput
When benchmarks don’t evolve, leaders unknowingly optimize toward outdated targets creating hidden financial leakage.
How Does Benchmark Drift Create Financial Blind Spots?
1. Productivity targets no longer reflect clinical complexity
As patient acuity rises, static RVU benchmarks penalize providers managing more complex cases. Leadership may interpret this as underperformance rather than a misaligned benchmark leading to flawed compensation and retention risk.
2. Compensation models quietly overpay or underpay
When compensation plans rely on outdated benchmarks, groups may over-incentivize volume or under-reward complexity and quality. This misalignment inflates labor costs or drives provider disengagement.
3. Staffing ratios drift out of economic balance
Benchmarks that don’t account for workflow changes or care model evolution result in overstaffing in some departments and understaffing in others raising operating costs without improving output.
4. Service line profitability becomes distorted
Leaders may continue investing in service lines that appear profitable under old benchmarks while overlooking emerging loss centers masked by outdated assumptions.
5. Value-based performance penalties increase
Benchmark drift causes gaps between actual care delivery and contract expectations. Missed quality thresholds, RAF underperformance, and attribution errors become more common.
6. Revenue leakage hides behind “acceptable” metrics
Charge capture, coding accuracy, and denial rates may appear stable yet still underperform relative to current industry standards. The gap represents silent revenue loss rather than visible failure.
7. Technology ROI is misjudged
When benchmarks don’t reset after EHR upgrades, AI tools, or workflow automation, leadership underestimates gains or worse, assumes tools failed when benchmarks were never recalibrated.
8. Compliance risk increases unnoticed
Outdated documentation and coding benchmarks fail to reflect heightened regulatory scrutiny. This creates exposure during audits despite “meeting internal targets.”
9. Cost containment strategies lose effectiveness
Supply chain, staffing, and operational cost benchmarks become disconnected from real utilization patterns leading to cost creep masked as normal variance.
10. Strategic decisions are based on false confidence
Perhaps the most dangerous blind spot: leadership believes performance is on track. Decisions around expansion, hiring, and contracting are made using benchmarks that no longer measure true health.
Real-World Impact: What Benchmark Drift Looks Like in Practice
In a large multi-specialty group operating across primary care, cardiology, orthopedics, and endocrinology, leadership relied on productivity and cost benchmarks established before a major payer mix shift toward value-based care.
Over three years:
- Provider productivity appeared stable
- Labor costs rose by 9%
- Value-based contract margins declined by 6%
Only after recalibrating benchmarks did leaders uncover:
- Increased documentation burden reducing visit throughput
- Higher patient complexity not reflected in RVU targets
- Staffing models built for fee-for-service volume
Once benchmarks were realigned:
- Productivity expectations normalized
- Compensation alignment improved
- Margin decline stabilized without cutting staff
The issue wasn’t performance. It was a measurement.


What Is the Bottom Line for Healthcare Leaders?
Benchmark drift doesn’t announce itself. It quietly reshapes decision-making until financial performance no longer matches effort.
For CEOs, CFOs, COOs, and service line leaders in multi-specialty groups, the message is clear:
If your benchmarks haven’t evolved with your care model, your financial strategy is already at risk.
Benchmark recalibration isn’t an analytics exercise, it’s a governance responsibility.
FAQs
1. What causes benchmark drift in multi-specialty groups?
Benchmark drift occurs when benchmarks remain static despite changes in payer mix, patient complexity, regulatory pressure, technology adoption, or care delivery models.
2. Why is benchmark drift financially dangerous?
It leads leaders to make decisions based on outdated assumptions, causing revenue leakage, cost inflation, and misaligned incentives without obvious warning signs.
3. How often should benchmarks be recalibrated?
At minimum, annually. More frequently during major shifts such as value-based contract expansion, technology rollouts, or regulatory changes.
4. Which benchmarks are most vulnerable to drift?
Provider productivity, staffing ratios, compensation models, denial rates, coding accuracy, and service line profitability benchmarks.
5. How does benchmark drift impact value-based care performance?
It masks underperformance against quality, risk adjustment, and utilization expectations leading to penalties and missed incentive opportunities.
6. What’s the first step to fixing benchmark drift?
Start by comparing internal benchmarks to current external standards and validating whether they reflect today’s clinical and operational reality.
Author Bio:

Kanar Kokoy
CEO - Chirok Health
Healthcare CEO & CDI/RCM innovator. I help orgs boost accuracy, integrity & revenue via truthful clinical docs. I've led transformations in CDI, coding, AI solutions, audits & VBC for health systems, ACOs & more. Let's connect to modernize workflows.