


What Healthcare Leaders Miss When Coding Performance Falls Outside National Benchmarks
Most healthcare executives monitor coding performance through internal dashboards. Clean claim rates, denial percentages, DNFB days, and cost-to-collect metrics are reviewed monthly. If numbers remain stable compared to the previous quarter, performance is often considered acceptable. But stability is not the same as competitiveness.
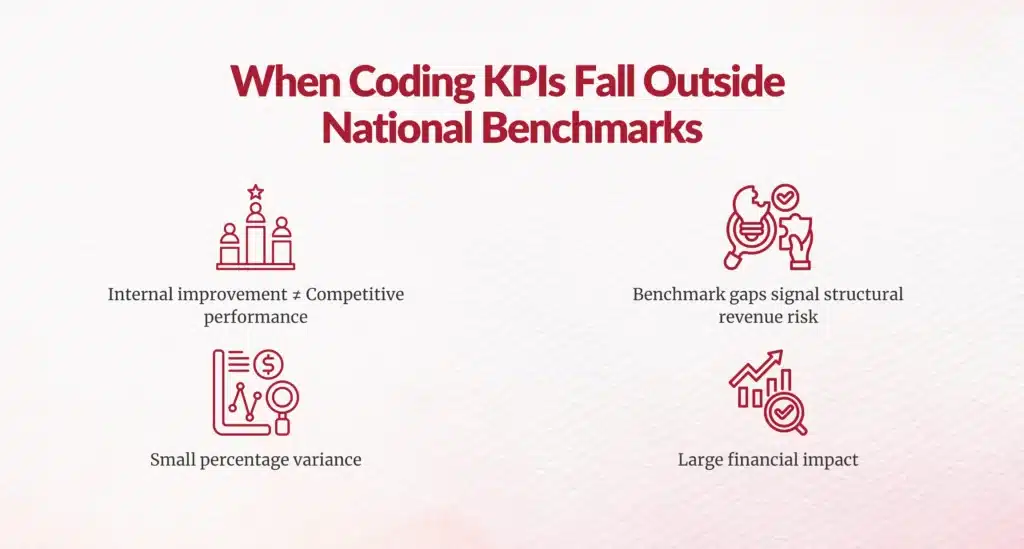
When coding performance falls outside national benchmarks even slightly the variance may represent structural financial risk rather than routine operational fluctuation. The most significant issue is not that performance dipped. It is that leadership may misinterpret the signal.
Benchmark variance is rarely cosmetic. It is diagnostic.
Why National Benchmarks Matter More Than Internal Stability?
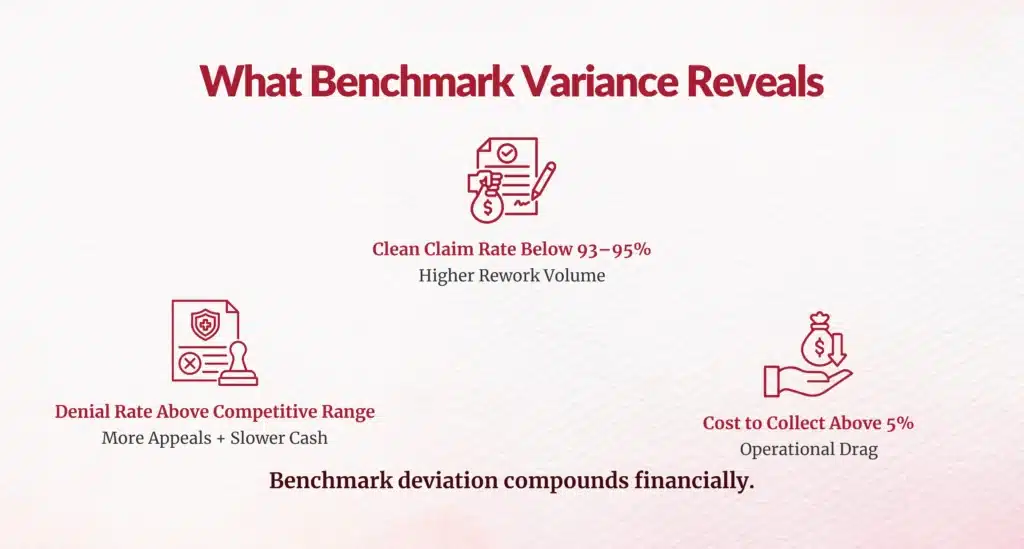
Internal historical comparison creates a false sense of security. If a clean claim rate improves from 84% to 86%, the trend appears positive. However, if national high-performance benchmarks operate at 93–95%, the organization remains structurally underperforming.
National benchmarks provide context. Without them, performance evaluation is relative only to internal past behavior not to market competitiveness.
When coding KPIs fall outside recognized performance ranges, it often signals deeper systemic issues in documentation alignment, workflow timing, denial prevention, or accountability integration. Benchmark gaps compound financially over time.
Which Coding Performance Variances Leaders Commonly Underestimate?
Coding performance is rarely a single-metric issue. Variance typically appears across multiple indicators simultaneously.
Clean Claim Rate Below Benchmark
High-performing healthcare organizations commonly operate with clean claim rates above 93%. When an organization remains in the mid-to-high 80s, leadership may consider performance “manageable.” However, every percentage point below benchmark increases downstream rework.
An 86% clean claim rate means 14% of claims require correction, resubmission, or appeal. That rework introduces administrative cost, delays revenue realization, and increases A/R days. Over tens of thousands of claims, even a 5–7% benchmark gap represents substantial labor expense and margin erosion.
The financial impact is rarely isolated to billing; it extends across the entire revenue cycle.
Denial Rates That Feel Normal but Are Structurally High
Denial rates between 8–12% are often perceived as common within healthcare organizations. However, top-performing systems maintain materially lower preventable denial rates.
When denial rates exceed national benchmarks, leadership may focus on appeal recovery percentages rather than root-cause prevention. This approach treats symptoms rather than structural inefficiencies.
Each denial increases the cost to collect. It introduces additional documentation review, payer communication, and delayed reimbursement. Even if revenue is eventually recovered, the operational expense reduces net yield. Benchmark variance in denial rate is rarely harmless.
Coding Productivity That Masks Accuracy Risk
High coding productivity may appear positive in isolation. However, if productivity rises while denial rates or audit findings increase, the organization may be trading speed for precision.
National productivity benchmarks exist for a reason—they balance throughput with defensibility. Performance outside those ranges may indicate staffing strain, inadequate training, insufficient documentation specificity, or workflow fragmentation.
Excessive variance either high or low signals imbalance.
Cost to Collect Above Competitive Range
Cost to collect is one of the most overlooked indicators of coding and revenue cycle health. High-performing organizations often operate within a 3–5% cost-to-collect range. When cost exceeds 6–8%, leadership frequently attributes the increase to payer complexity or staffing shortages.
However, structural coding inefficiency and preventable denial rework are major cost drivers. When coding performance falls outside benchmark, cost to collect typically rises in parallel.
Benchmark gaps cascade operationally.
Why Leadership Often Misreads the Signal?
When performance drifts outside national benchmarks, leadership may attribute variance to temporary operational issues: staffing transitions, seasonal volume shifts, payer contract changes, or system upgrades.
While these factors can contribute, persistent variance usually reflects deeper structural misalignment:
- Delayed documentation clarification
- Siloed CDI, HIM, and RCM workflows
- Reactive denial management rather than upstream prevention
- Conservative coding due to documentation ambiguity
- Insufficient provider education
Benchmark deviation is rarely a random anomaly. It is a pattern indicator.
The Compounding Financial Effect of Benchmark Variance
Consider a mid-sized health system submitting 100,000 claims annually.
If the clean claim rate is 7% below benchmark, that equates to 7,000 additional claims requiring rework. If each reworked claim costs even a modest administrative amount in labor, the operational expense escalates quickly.
If denial rate exceeds benchmark by 3–5%, delayed reimbursement increases A/R days and reduces liquidity predictability.
If E/M leveling trends below peer distributions, legitimate reimbursement may be suppressed quietly without denial visibility.
Individually, these variances may appear tolerable. Collectively, they create structural margin compression. Benchmark deviation compounds.
What Benchmark Alignment Actually Requires?
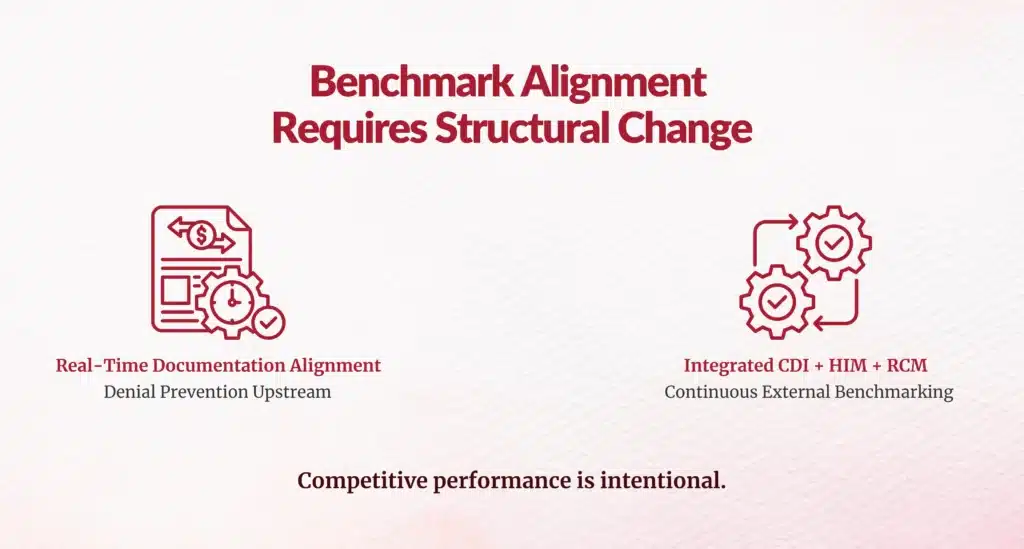
Improving coding performance to national benchmark levels is not achieved through isolated KPI monitoring. It requires systemic integration.
Documentation review must align with coding workflows in real time. Provider education must focus on specificity and medical decision-making clarity. Denial prevention must occur before claim submission rather than after remittance.
Cross-functional collaboration between CDI, HIM, compliance, and revenue cycle leadership is essential.
Benchmark alignment is not a metric adjustment; it is an operational redesign.
Final Thoughts
When coding performance falls outside national benchmarks, the issue is not reputational.
It is financial.
National benchmarks represent aggregated performance from high-functioning organizations operating within similar regulatory and payer environments. Sustained deviation from those ranges signals structural inefficiency.
The most significant mistake healthcare leaders make is assuming internal improvement equals competitive performance.
If your clean claim rate improves from 82% to 85%, progress has occurred. But if competitive systems operate at 94%, you remain exposed.
Benchmark variance is not cosmetic.
It is an early warning system for margin instability, operational drag, and preventable revenue suppression.
The question is not whether your organization has improved internally.
The question is whether it is performing competitively within the national landscape.

FAQs
Why are national benchmarks more important than internal historical comparisons?
Internal trends show improvement relative to past performance. National benchmarks show competitiveness relative to the broader healthcare environment. Both are necessary, but benchmarks reveal structural exposure.
Can temporary operational disruptions justify falling outside benchmark?
Short-term fluctuations may occur during transitions. However, persistent variance typically indicates systemic inefficiency rather than temporary disruption.
What metrics should leaders prioritize first?
Clean claim rate, denial rate, cost to collect, A/R days, and E/M distribution patterns provide early signals of coding and documentation alignment.
Is benchmark variance always negative?
Not necessarily. Performance significantly above benchmark may signal audit or compliance risk if coding intensity exceeds defensible documentation standards. Variance in either direction warrants investigation.
Author Bio:

Kanar Kokoy
CEO - Chirok Health
Healthcare CEO & CDI/RCM innovator. I help orgs boost accuracy, integrity & revenue via truthful clinical docs. Led transformations in CDI, coding, AI solutions, audits & VBC for health systems, ACOs & more. Let’s connect to modernize workflows.