


Why 10–15% Benchmark Variance in Routine Visits Can Quietly Cost Healthcare Systems Millions
How “Acceptable” Revenue Performance Masks Multi-Million-Dollar Losses?
If your organization’s routine outpatient visits are running 10–15% below benchmark on clinical documentation accuracy, clean claim rate, or payment realization, you are almost certainly losing millions of dollars a year, even if your revenue reports look “acceptable” on the surface.
And here’s the uncomfortable part:
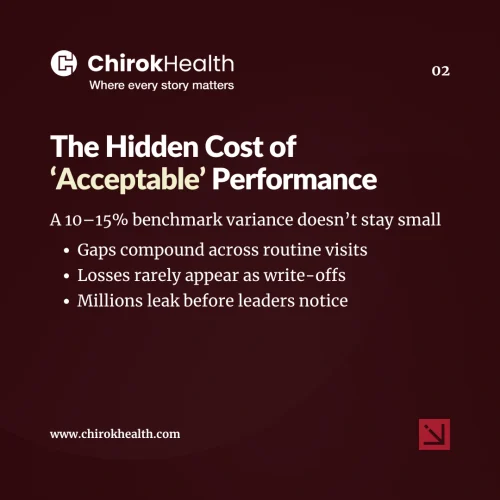
Most healthcare leaders don’t see the loss until it’s already compounded.
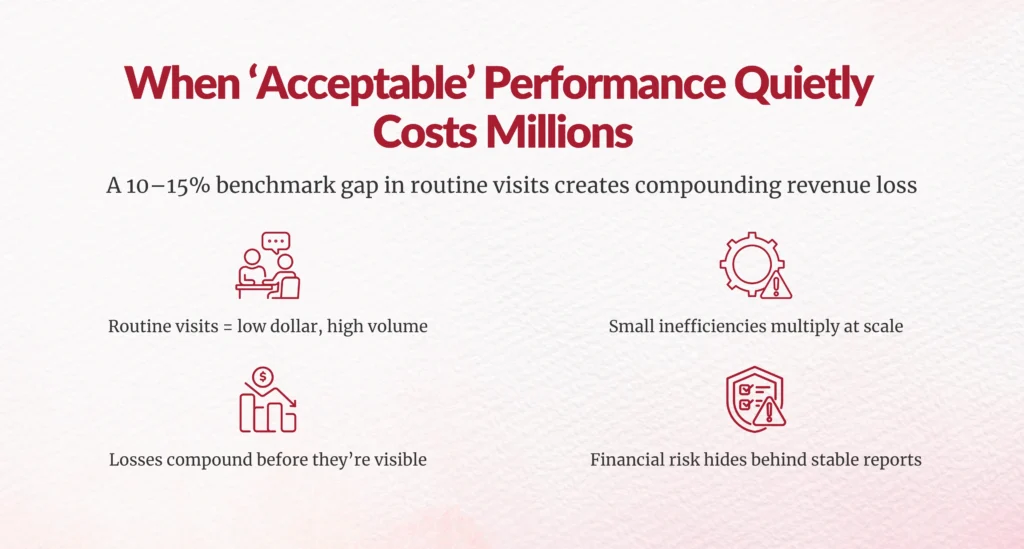
This isn’t about catastrophic failure. It’s about small, normalized inefficiencies across thousands, sometimes millions, of routine encounters quietly draining revenue, increasing cost to collect, and slowing cash flow.
If you’re a healthcare leader responsible for revenue and performance, this blog is written for you, because benchmark variance is no longer an operational issue. It’s a financial risk.
What Does a 10–15% Benchmark Variance Actually Mean in Real Terms?
Let’s ground this immediately.
When we talk about “benchmark variance,” we’re talking about the gap between how your organization performs and how high-performing peer organizations perform across core revenue cycle and documentation metrics.
That includes metrics like:
- Clean claim rate
- Documentation completeness and specificity
- Denial rate
- Days in A/R
- Net collection rate
- Cost to collect
Organizations aligned with industry best practices, including benchmarks published by HFMA and MGMA, consistently outperform peers by tightening these metrics.
A 10–15% variance means you are systematically underperforming, not occasionally, not incidentally, but structurally.
And structural underperformance always turns into structural revenue loss.
Why Do Routine Visits Create the Largest Financial Blind Spot?
Here’s the paradox you may recognize.
Routine visits feel “safe.”
Low dollar. High volume. Familiar workflows.
That’s exactly why they’re dangerous.
Routine E/M encounters make up the largest share of outpatient volume in most health systems. Even modest inefficiencies, when repeated thousands of times a month, create outsized financial impact.
According to the American Hospital Association, outpatient services now represent more than 50% of hospital revenue in many systems, and routine visits drive a significant share of that volume.
When documentation, medical coding, or claim quality is even slightly off at scale, the math becomes brutal.
How Does a 10–15% Variance Turn Into Millions of Dollars Lost?
Let’s walk through this the way finance leaders think, through accumulation, not anecdotes.
How Much Revenue Is Lost Through Preventable Denials Alone?
Industry data consistently shows initial claim denial rates between 8–12%, with up to 65% of denials classified as preventable.
If your clean claim rate is 10–15% below benchmark:
- More claims require rework
- More claims age into delayed A/R
- More claims are never fully recovered
Every denial doesn’t just delay revenue, it consumes staff time, increases administrative cost, and reduces the likelihood of full reimbursement.
On high-volume routine visits, even a few dollars lost per encounter compounds into seven-figure leakage annually.
How Does Documentation Variance Lead to Underpayment, Not Just Denials?
This is where many organizations underestimate the problem.
Not all revenue loss shows up as a denial.
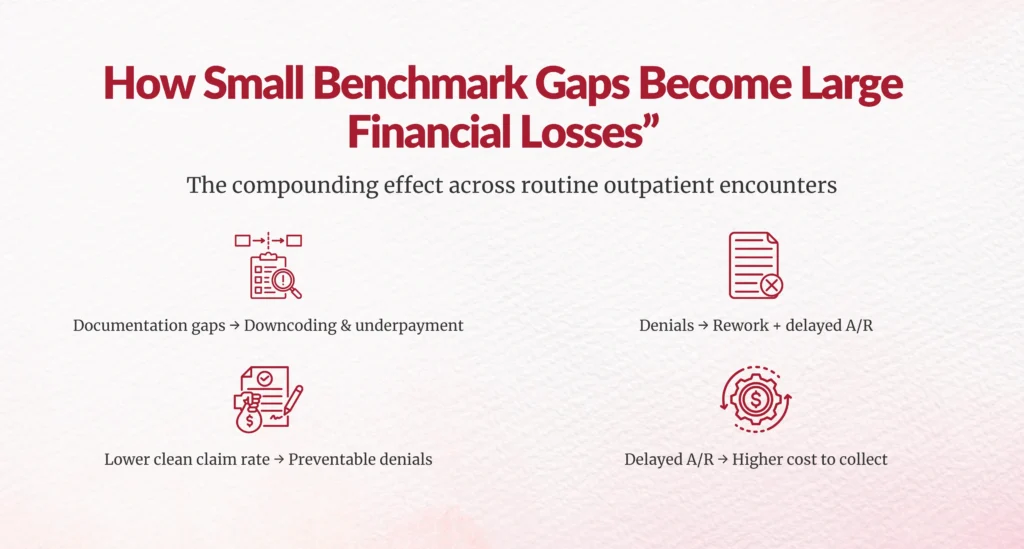
Incomplete or nonspecific documentation often leads to:
- Down-coded E/M levels
- Missed complexity capture
- Incorrect risk adjustment
- Reduced medical necessity defensibility
Payers don’t have to deny the claim to reduce payment, they just have to pay less.
MGMA research shows under-coding and documentation gaps contribute to 5–10% revenue loss in outpatient settings without triggering obvious denial spikes.
That means your reports can look “stable” while money quietly disappears.
How Does Benchmark Variance Increase Cost to Collect?
High-performing organizations typically operate with a cost to collect between 3–5% of net revenue.
Organizations with documentation, coding, and workflow inefficiencies often exceed 6–8%.
That difference doesn’t sound dramatic, until you apply it to scale.
For a health system generating $500M in annual revenue, a 2% excess cost to collect equals $10M in unnecessary operational spend.
That’s money not going to technology, staffing stability, or patient access.
Why Don’t Leadership Teams See This Earlier?
If this problem is so expensive, why does it persist?
Because benchmark variance hides in plain sight.
Are “Acceptable” KPIs Masking Structural Underperformance?
Many teams measure performance internally, month over month, year over year, without anchoring against external benchmarks.
If everyone improves slowly together, the gap never feels urgent.
But industry leaders are improving faster.
HFMA data shows organizations using advanced analytics and proactive CDI models outperform peers on clean claim rate and denial prevention by double-digit margins.
Relative improvement isn’t the same as competitive performance.
Does Siloed Accountability Make the Problem Worse?
Absolutely.
Benchmark variance rarely belongs to one department.
- CDI sees documentation gaps
- HIM sees coding inconsistencies
- RCM sees denials and delays
- Finance sees cash flow impact
But without shared ownership, no one sees the full cost curve.
Revenue leakage thrives in handoffs.
What Are the Most Common Drivers of Routine Visit Benchmark Variance?
Based on industry analysis and operational reviews, the same culprits appear again and again.
Is Clinical Documentation Keeping Pace with Payer Expectations?
Payer scrutiny has increased,but provider documentation models often haven’t.
Routine visits now require:
- Greater specificity
- Clear medical necessity articulation
- Consistent problem-oriented documentation
When providers document for clinical memory instead of reimbursement reality, variance grows.
Are Coding and CDI Models Built for Volume, or Complexity?
Many CDI programs were designed for inpatient DRG optimization.
Routine outpatient visits demand a different model, one that balances speed, accuracy, and scalability.
Without it, organizations either miss revenue or create unsustainable rework.
Are Analytics Reactive Instead of Predictive?
Most revenue cycle analytics answer the question:
“What went wrong?”
High-performing organizations also ask:
“What is about to go wrong and how do we stop it?”
Predictive denial analytics and documentation risk scoring are now proven to reduce denial rates and A/R days materially.
How Can You Estimate the Financial Impact in Your Own Organization?
You don’t need a consulting firm to start.
Ask yourself three questions:
- Where are we 10–15% below benchmark today?
- How many routine visits does that metric affect annually?
- What is the average revenue delta per visit?
Multiply conservatively.
Most leaders are shocked by the result.
What Should You Do First If This Sounds Familiar?
Start small, but start deliberately.
Are You Benchmarking Against External Standards Monthly?
If benchmarking happens annually, it’s already too late.
High-performing systems track benchmark deltas monthly and trend them longitudinally.
Are CDI, HIM, and RCM Aligned Around the Same Metrics?
If each team defines “success” differently, variance will persist.
Alignment is not cultural; it’s operational.
Are You Treating Routine Visits as Strategic Revenue Drivers?
Routine does not mean low-impact.
At scale, routine visits are the revenue engine.


Why This Matters More in 2026 Than Ever Before?
Margins are thinner.
Payers are stricter.
Patients are more price-sensitive.
In this environment, 10–15% benchmark variance is not noise, it’s a signal.
And the organizations that respond early don’t just recover revenue.
They stabilize operations, reduce burnout, and protect long-term financial health.
What Would Recovering Even Half of That Variance Enable?
More staff stability.
Better technology investment.
Stronger patient access.
Less financial pressure downstream.
Benchmark variance isn’t inevitable.
It’s measurable.
And it’s fixable.
The question is whether you’re ready to look at it head-on.
FAQs
What does a 10–15% benchmark variance mean for a healthcare organization?
A 10–15% benchmark variance means your organization is consistently performing below industry standards across key revenue cycle and documentation metrics such as clean claim rate, denial rate, documentation accuracy, or payment realization. This level of variance is not random or seasonal. It reflects structural inefficiencies that, when applied across high-volume routine outpatient visits, almost always translate into significant and recurring revenue loss.
Why can revenue performance look “acceptable” even when millions are being lost?
Revenue reports often reflect aggregate collections, not missed opportunity. Benchmark variance typically shows up as under-coded visits, partial payer payments, delayed reimbursements, and higher administrative effort rather than obvious write-offs. Because these losses are distributed across thousands of routine encounters, they compound quietly over time and are rarely visible without external benchmarking and deeper analytics.
Why are routine outpatient visits the biggest source of hidden revenue leakage?
Routine outpatient visits represent high volume and predictable workflows, which creates a false sense of safety. Even small documentation or claim quality gaps, when repeated at scale, result in outsized financial impact. Because each individual visit appears low risk, organizations often overlook how quickly small inefficiencies multiply into seven-figure losses annually.
How does benchmark variance lead to revenue loss without increasing denial rates?
Not all revenue loss comes from denials. In many cases, incomplete or nonspecific documentation leads to down-coded E/M levels, missed complexity capture, or reduced medical necessity defensibility. Payers do not need to deny the claim to reduce payment. As a result, organizations may see stable denial rates while still losing 5–10% of potential revenue on routine visits.
Is benchmark variance primarily a CDI issue or a revenue cycle issue?
Benchmark variance is a shared problem that spans CDI, HIM, revenue cycle operations, and finance. Documentation gaps originate upstream, coding inconsistencies occur in the middle, and denials or underpayments appear downstream. When accountability is siloed, no single team sees the full financial impact, allowing revenue leakage to persist across handoffs.
How much financial impact can a 10–15% benchmark variance realistically create?
For most mid-to-large healthcare organizations, a sustained 10–15% variance can result in millions of dollars in lost revenue each year. This loss comes from preventable denials, underpayments, delayed cash flow, and higher cost to collect. Even modest improvements in benchmark alignment can unlock significant financial recovery, especially in high-volume outpatient settings.
Why don’t organizations detect benchmark variance earlier?
Many organizations track performance internally rather than against external benchmarks. When improvement is measured only month over month or year over year, underperformance relative to peers can remain invisible. Benchmark variance also develops gradually, which makes it easy to normalize and difficult to recognize without intentional benchmarking discipline.
Is annual benchmarking sufficient to manage benchmark variance?
Annual benchmarking is no longer sufficient. By the time annual results are reviewed, revenue loss has already compounded. High-performing organizations benchmark monthly and trend performance over time so they can identify early warning signals and intervene before financial impact escalates.
How does benchmark variance affect cost to collect?
Lower documentation accuracy and higher rework rates increase manual effort across the revenue cycle. This raises staffing costs, extends A/R days, and pushes cost to collect above industry norms. Over time, benchmark variance converts what should be margin into operational overhead.
What are the most common drivers of benchmark variance in routine visits?
The most common drivers include outdated documentation practices that do not align with current payer expectations, coding and CDI models built for inpatient complexity rather than outpatient volume, fragmented workflows across systems, and analytics that focus on retrospective reporting instead of predictive risk identification.
How can healthcare leaders estimate the impact of benchmark variance internally?
Leaders can start by identifying where performance is 10–15% below industry benchmarks, determining how many routine visits are affected annually, and estimating the average revenue difference per visit. Even conservative calculations often reveal financial impact far greater than expected, which helps prioritize corrective action.
Is fixing benchmark variance achievable without major system overhauls?
Yes. Many organizations recover meaningful revenue through targeted improvements such as documentation specificity, claim quality controls, CDI and coding alignment, and better analytics visibility. Because routine visits operate at scale, even small operational improvements can generate substantial financial returns.
Why is benchmark variance considered a financial risk today?
Benchmark variance directly affects net revenue, cash flow predictability, cost to collect, and long-term margin sustainability. In an environment of tighter margins, stricter payer scrutiny, and rising administrative costs, persistent variance undermines financial resilience even when operations appear stable.
What is the first step leadership should take to address benchmark variance?
The first step is visibility. Leadership must benchmark performance against external standards, quantify the financial impact of variance, and align CDI, HIM, RCM, and finance teams around shared metrics. Without clear visibility, benchmark variance cannot be effectively managed or reduced.
Is benchmark variance inevitable in complex healthcare systems?
Benchmark variance is not inevitable, but ignoring it is common. Complexity does not cause revenue leakage. Lack of alignment, measurement, and accountability does. Organizations that treat benchmark variance as a strategic signal rather than background noise consistently outperform peers financially.
Author Bio:

Kanar Kokoy
CEO - Chirok Health
Healthcare CEO & CDI/RCM innovator. I help orgs boost accuracy, integrity & revenue via truthful clinical docs. I've led transformations in CDI, coding, AI solutions, audits & VBC for health systems, ACOs & more. Let's connect to modernize workflows.