


How National Coding Benchmarks Exposed a $7.35M Revenue Gap in a Single Healthcare Organization
Why Healthcare Leaders Are Reexamining Revenue Capture Through National Benchmarks
Healthcare leaders often ask a simple but high-stakes question:
“Are we actually capturing the full value of the care our clinicians deliver?”
For one multi-specialty healthcare organization, the answer emerged with striking clarity using a PHI-free coding benchmark analysis. The national coding benchmark analysis uncovered revenue opportunities that was upto $7.35 million in compliant, undercaptured revenue without increasing patient volume, renegotiating payer contracts, or changing clinical workflows.
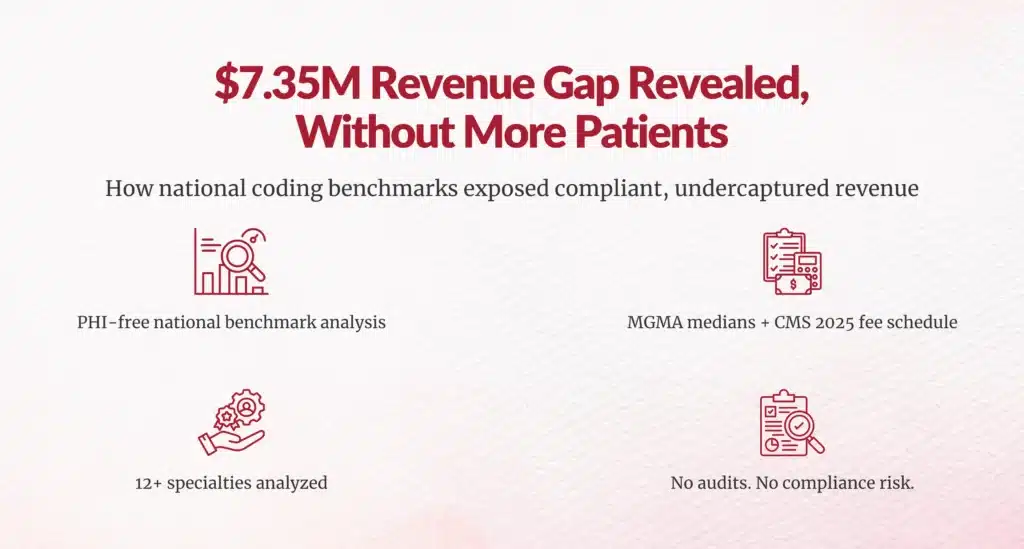
This wasn’t the result of fraud, billing errors, or failed audits. It was the outcome of documentation-supported services not being fully translated into reimbursable codes.
In this article, you’ll learn:
- How national benchmarks revealed the gap
- Where the $7.35M opportunity came from
- Why common reporting misses these issues
- What actions healthcare leaders should take now
Let’s start with the answer you’re here for.
What Was the $7.35M Revenue Gap and Why Does It Matter to You?
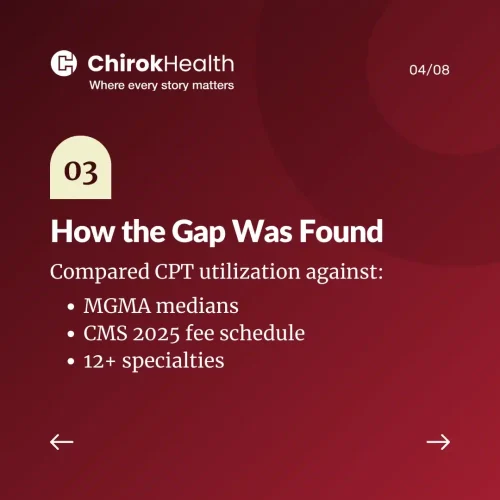
The $7.35M revenue gap represents legitimate reimbursement opportunity identified by comparing a healthcare organization’s CPT utilization rates against national benchmarks, including:
- MGMA median utilization rates
- CMS 2025 Physician Fee Schedule
- Specialty-specific coding expectations across 12+ specialties
The analysis was conducted by Chirok Health using 3–6 months of historical CPT billing data. Importantly, this was not an audit or compliance investigation. It was a benchmark variance analysis designed to answer one core question:
“How does our coding performance compare to peers delivering similar care?”
According to MGMA, even small deviations from national medians especially in E/M services can result in seven-figure revenue impact annually for large provider groups
For healthcare leaders, this matters because margin pressure is intensifying. Kaufman Hall reports that more than 50% of hospitals continue to operate with margins under 2%, making revenue leakage unsustainable.
Why Do National Coding Benchmarks Reveal Gaps Internal Reports Don’t?
Your internal dashboards likely tell you:
- Total charges
- Net collections
- Denials
- Case mix index
- Coding productivity
What they don’t tell you is what should have been captured.
Why Benchmarking Changes the Conversation
National benchmarks introduce external truth into internal performance discussions. They help you see:
- Underutilized CPT codes
- Specialty-specific variation
- Missed add-on codes tied to visit complexity
- Preventive services are inconsistently billed
CMS and the Office of Inspector General (OIG) have repeatedly highlighted coding variation as a systemic issue, not an individual failure.
When organizations rely solely on internal trend lines, underperformance becomes normalized. Benchmarks break that illusion.
How Was the Revenue Opportunity Identified Without Increasing Compliance Risk?
One of the most important aspects of this analysis is what it does not imply.
This $7.35M gap does not suggest:
- Overcoding
- Prior billing errors
- Compliance violations
Instead, it highlights documentation-supported services that were either undercoded or not coded at all.
What Methodology Was Used?
The core methodology included:
- Reviewing CPT billing data across 3–6 months
- Comparing service-level utilization against MGMA medians
- Applying CMS 2025 fee schedules
- Aggregating opportunity across 12+ specialties
Every opportunity identified required:
- Appropriate clinical documentation
- Payer-aligned rules
- CMS-compliant billing logic
This distinction is critical for CDI and HIM leaders responsible for compliance oversight.
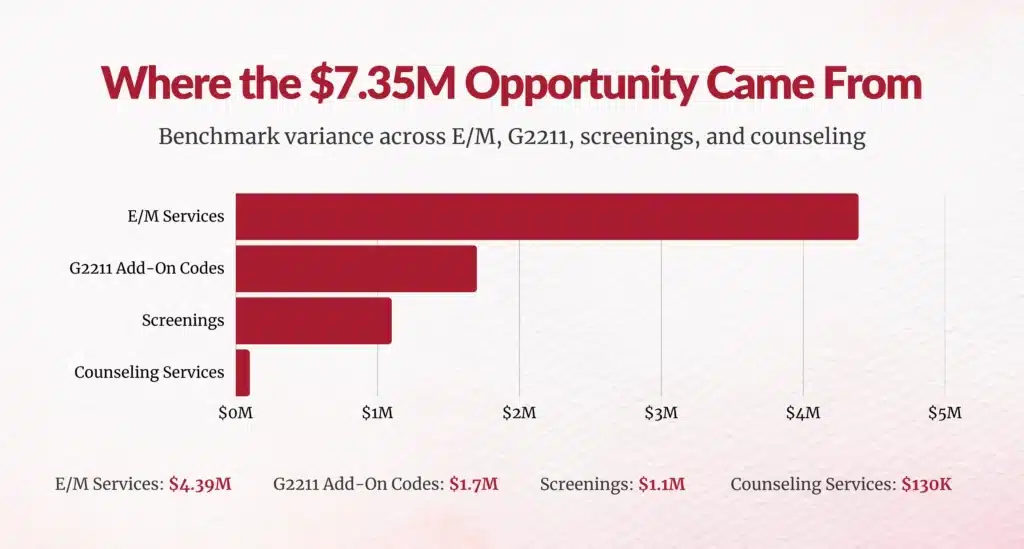
Where Did the $7.35M Revenue Gap Come From?
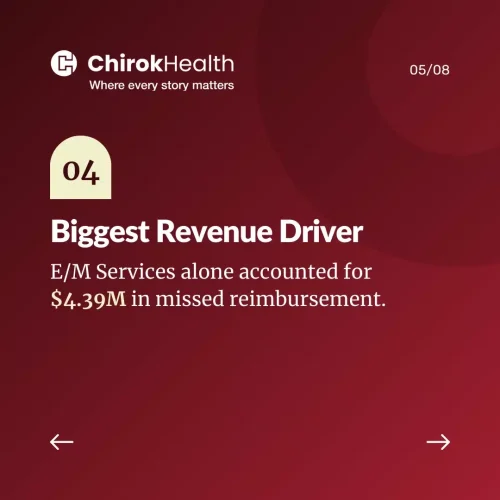
Why Did E/M Services Account for $4.39M?
E/M services represented the single largest opportunity, totaling $4.39M.
A striking example:
- Family Medicine E/M capture rate: 1%
- MGMA national median: 4%
That 3% delta translated into millions.
CMS data shows that E/M services account for more than 40% of total Medicare Part B payments, making them the highest-impact area for revenue integrity initiatives.
E/M undercapture often stems from:
- Visit complexity not fully documented
- Inconsistent leveling across providers
- Lack of real-time CDI support
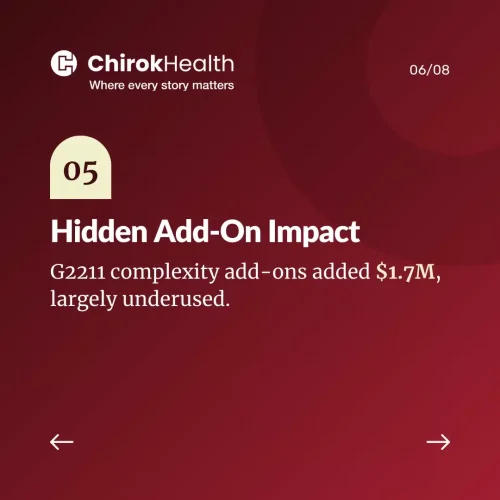
How Did G2211 Add-On Codes Contribute $1.7M?
The G2211 complexity add-on was designed to recognize the cognitive and longitudinal burden of managing patients, particularly in primary and specialty care.
Yet adoption remains inconsistent.
In this organization:
- Family Medicine: $792K opportunity
- Dermatology: $201K opportunity
- Multiple specialties: Ongoing underutilization
CMS estimates that G2211 will generate billions in Medicare reimbursement annually, but only if documentation supports its use.
The challenge isn’t clinician resistance; it’s workflow-integrated documentation support.
Why Did Screenings and Counseling Quietly Add Up to $1.23M?
Preventive and counseling services often suffer from a visibility problem.
In this analysis:
- Screenings: $1.1M
- Counseling services: $130K
Commonly undercaptured codes included:
- Depression screening (G0444)
- Pap smears (G0101)
- Smoking cessation (99406)
- Advance care planning (99497)
OB/GYN alone accounted for $657K in missed screening revenue.
The CDC recommends routine depression screening for all adults in primary care, yet billing data consistently lags clinical practice.
Which Specialties Were Most Impacted and Why?
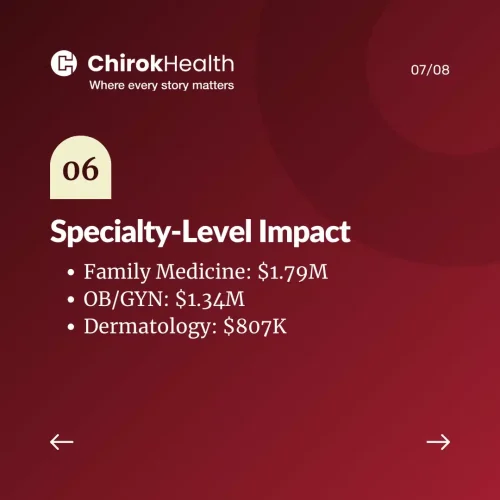
Why Did Family Medicine Lead With $1.79M?
Family Medicine represented the largest total gap at $1.79M, driven by:
- G2211 underuse ($792K)
- Screening gaps ($193K)
- E/M compression
Primary care physicians manage over 80% of chronic disease care, yet their work is often undervalued in claims data.
How Did OB/GYN and Dermatology Exceed $2M Combined?
- OB/GYN: $1.34M (primarily screenings)
- Dermatology: $807K (E/M + G2211)
These findings reinforce a key insight:
Undercapture is not limited to primary care; it spans all specialties where visit complexity evolves over time.

What Actions Should CDI, HIM, and RCM Leaders Take?
Why Is Concurrent CDI the Highest-Impact Strategy?
Retrospective audits identify missed revenue after the fact. Concurrent CDI prevents leakage at the point of care.
Best-performing organizations implement:
- Real-time clinician queries
- Specialty-trained clinician coders
- EHR-embedded CDI workflows
- Monthly performance dashboards
AHIMA reports that organizations using concurrent CDI see up to a 25% increase in documentation specificity within six months.
How Do You Balance Revenue Optimization With Compliance?
For HIM and compliance leaders, this question is non-negotiable.
Effective programs focus on:
- Payer-specific rules
- CMS documentation standards
- Audit-ready workflows
- Transparent analytics
Chirok Health reports 95%+ coding accuracy, demonstrating that compliance and revenue integrity are complementary, not competing, goals.
Why CFOs and CMOs Should Be Paying Attention Now
Healthcare organizations are being asked to do more with less:
- Flat reimbursement
- Rising labor costs
- Increasing regulatory scrutiny
When millions in compliant revenue already exist within your documentation, failing to act becomes a strategic risk.
For CMOs, this is about ensuring clinical complexity is accurately represented.
For CFOs, it’s about financial sustainability without cost-cutting care.
Are National Benchmarks Your Biggest Blind Spot?
A single organization uncovered $7.35M in opportunity without:
- Seeing more patients
- Adding new services
- Changing payer contracts
They simply aligned documentation, coding, and national benchmarks.
As a CDI Director, HIM leader, VP of Revenue Cycle, or CFO, the real question isn’t whether undercapture exists, it almost certainly does.
The question is:
How long can you afford not to measure it?
National coding benchmarks don’t just expose revenue gaps.
They give healthcare leaders a clear, compliant roadmap to reclaim value already earned.
Author Bio:

Kanar Kokoy
CEO - Chirok Health
Healthcare CEO & CDI/RCM innovator. I help orgs boost accuracy, integrity & revenue via truthful clinical docs. I've led transformations in CDI, coding, AI solutions, audits & VBC for health systems, ACOs & more. Let's connect to modernize workflows.